

No matter how well you attract users to your site, in the end, all that matters is how well you engage, retain, and convert them. And the first measuring yardstick of how well you are doing to receive them is Bounce Rate.
Bounce Rate decides your fate in an online business. If you are dealing with a high bounce rate and your users return without paying attention to your pages, it is going to adversely affect your growth and detain your entire idea of online communication and business.
If you want to take it in the right direction, you need to attain good results with the bounce rate in the first place. And to do this well you need to know what a good bounce rate is.
Before we do that, let’s first check what technically Bounce Rate is going by its definition. As defined by Google, “Bounce Rate is a single-page session marked by a situation where a user lands on your site and doesn’t interact with its elements and chooses to discontinue and go back.” There are various criteria set by search engines to consider a bounce session based on the behavior of the user on the site. This includes various factors like time on site, navigation, user activity, etc.
A Bounce Rate Can Be Triggered By The Following Events:
- Closing the browser
- Going back to search results
- Any outbound diversion
- Overwriting the URL on the address bar
- Staying inactive for a long time
- Not interacting with any of the site elements
All these inevitable user actions can strike a visitor-bounce on your site. And there’s no way to avoid a user bounce completely. But, there are standards defined by experts that define bounce rate as good or bad based on certain parameters. So, how and to what extent a bounce rate can be considered acceptable.
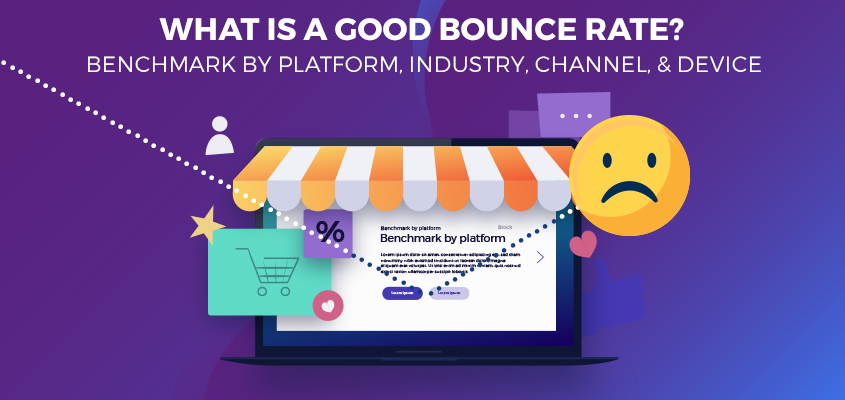
Or Simply Put – “What is a Good Bounce Rate?”
This question, however, is not as straight and simple to answer. As it is always based on different factors and nuances innate to a particular business situation and case. The ideal score of a bounce rate varies across the type of platform or service base, domain or segment, channel or source of traffic, and the device type.
The idea of a good bounce rate largely varies as per these factors. To know what bounce rate is a good bounce rate for you, check out these standard benchmarks suggested by domain experts and professionals.
Benchmarks by Platform/website Type
The type of your website has a lot to do with the count of bounce rate. If you have a site that provides information on courses or examination patterns it will have a higher bounce rate compared to an e-commerce site that sells books or resources targeting the same cloud of audience.
A simple reason behind this is, the visitors on the information sites demonstrate typical behavior of landing on these pages just to consume content and skip to do any interaction with the page elements and events. Also, most of the users who land on reference sites are directed through some media posts. And they are most likely to return to the source page where they resume what they left in the middle.
However, in the case of an online selling site, the users are most likely to spend their time searching and exploring products. Also, they would interact with different events on the site and navigate through product and category pages. Which makes the numbers of bounced sessions of these platforms go down considerably.
Also, there are many other platforms catering to different needs and purposes and has a different value perspective to serve. For example, on-demand services sites, payment apps, review and rating portals, and booking applications. These mostly cater to specific service needs and have a very focused target audience to serve with an immediate reason, fair necessity, and high intent to interact with the service. Also, these mostly face lesser competition due to the size and complexity of offering. Therefore, these sites are expected to receive lower bounce rates than a blog or an online store.
Benchmark by Industry and Functional Domain
The industry and the segment you are operating in also affects the probable bounce rate. This is because of various factors like market competition, ticket size, value proposition, service orientation, nature of the offering, and audience type.
As per the reports, the industries that observe the most bounce rates are Food and Beverages, Science, References, People & Society. However, the ones with the least are Real Estate, Shopping, Games, and Jobs & Education.
The difference in the bounce rate of the industries standing at the two extremes is about 20%, with the Food domain having the worst performance with around 65% of users returning from the sites without completing a valid session. On the other side of the bar is Real Estate, which accounts for the least number of bounce sessions with a rate of 45%.
A combination of the above-mentioned factors and the structural differences between these domains is the key reason for this.
If you would like to know where does your industry or functional segment stands, you can take the help of the benchmarking feature of Google Analytics. Here, you can view data for over 1600 domain categories setting up your own measuring yardsticks selecting your location, traffic level, etc.
Benchmarks by Channel
Traffic channels differ in the way they pronounce bounce rates. This is one of the areas that you can control and maneuver to work in your favor. As you can choose your channels that you would like to drive traffic through. And this is going to impact the quality of your leads and the conversion value to a large extent.
Here are the different forms of channels a website gets traffic from:
- Direct: User visits directly through the URL of the page
- Organic Search: Visits that take place through organic search results
- Paid Search: Users come to your site through PPC and other paid ads
- Social: User visits contributed by social networks
- Display: Traffic from banner ads
- Referral: Users diverted to site from links on other sites
- Email: Users reaching site clicking links in the email
These channels have their own standards of bounce rate. The highest bounce registered by any channel rests with display ads which are around 56%. A considerable reason for this is that banner and display ads are viewed as clutter and introduce the least motivated and disoriented users to the site. The best performing channel here is the email with a rate of 35%. This is owing to the innate behavior and mindset of the email user, who do not choose to open all the emails, but when they do (mostly in the case of opted-in ones) they have a high interest and intent.
Benchmark by Device
This is another effective way to set the benchmark of bounce rates. As per a study done over users from three different industry segments – shopping, advertising & marketing, and finance, it was established that mobile users contribute to higher bounce rates compared to those of tablets and desktops. All of these segments reflected a similar pattern where mobile phones witnessed the most bounce rates and tablets stood at the mid bracket range while desktops accounted for the least.
Going by the proportions, the Shopping vertical observed a 48% rate of bounce with mobile device users, followed by a 43% rate registered by the tablet users and lastly a 41% rate appointed by the desktop users. These trends witnessed higher marks in the case of Advertising & Marketing, with a rating share of 69%, 61%, and 56% respectively. However, in the segment of Finance, these rates stood at 57%, 52%, and 48% respectively.
So, if you are a mobile-first service that depends mostly on mobile phone users, you need to make sure you commit to best practices and techniques to improve and optimize sessions for mobile devices. This will help you attain lower bounce rates and have better chances at inducing users to stay and interact and make your site perform better on a mobile phone.
Setting a Baseline Bounce Rate
Benchmarks are defined to give you an idea of the performance averages. So, you know how websites perform in a general scenario and track your performance level taking an inclusive comparison. This is nowhere a suggested mark of bounce rate that you should be looking to achieve. Your aim should be to define your own standards looking at how your competitors are doing and tracking user response and patterns on your site. Look at similar web pages and compare their rates. This should give you a fair idea to set your personal baseline that is contextually relevant and applicable in your case.
Conclusion
The best way to refer to these benchmark bounce rates is by taking up segmented data that are churned and deduced to get you evaluative measures. This can be best done by preparing a performance matrix that brings together all the benchmark factors applicable in your situation and by pooling and collating derivative averages. Here, you should also bring in the data of the closest competitors and the best averages that have been attained in your category. This would prevent you from falling for the deceiving KPIs and get you to take the right plan towards optimizing your bounce rate.
While you do all this, look for the industry averages just to help you get an idea of the current position and to lead you forward in the right manner. Take the reference from these standards but always take a route to best support your case. Set your own standards of a good bounce rate reading your patterns and tracking your immediate competitive scenario and business situation. And you should be all ‘good’!