


Are you doing good with your e-commerce marketing efforts? Are you getting enough conversions? How about the ad performance? Is it all going in the right direction? These are some questions that every e-commerce business has in mind.
New e-commerce startups are worried about the accuracy of their investment plans. While businesses on a roll always want to keep their ROIs on high-performance marks. Marketers always want to get better results through the course and scale-up the volume of conversions. Everyone is trying to hit the cord with the market opportunities and get the best value out of the ever-competitive online commerce space.
To be able to set your KPIs, assess your performance, and validate the ideal conversion rate and order value in your situation, you need to first go through industry benchmarks and see how you compare.
Before your dive into the graphs and stats of industry-wide conversion standards and trends, you should know how conversion rate is measured.
Simply put, sales transactions divided by the number of unique visits on your site, give you the conversion rate.
Here’s how Google defines conversion rate: “The ratio of transactions to sessions, expressed as a percentage. For example, a ratio of one transaction to every ten sessions would be expressed as an Ecommerce Conversion Rate of 10%”.
Now, that’s the fundamental formula. This rate varies everywhere and with every situation. A conversion rate ideal for a business selling craft items may not be anywhere achievable by a baby products brand.
So, let’s find how conversion rates are measured across industry verticals, and functional niches for different locations, channels, and devices. So, you get an overall picture of the ideal performance metrics and parameters to compare your’s with.
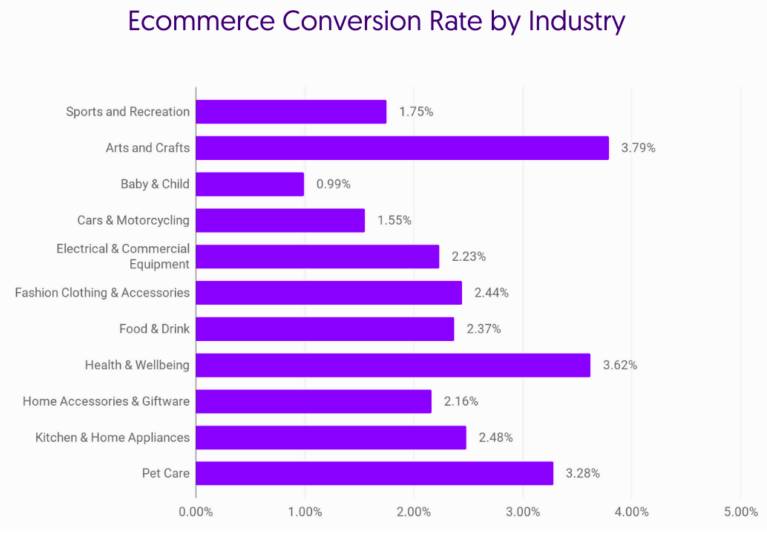
Comparison Across Industry Verticals
A January 2021 update compares different sectors head-to-head referring to market aggregates based on collated data collected for different e-commerce businesses. Seeing these conversion rates across verticals you can have an idea of how conversion averages vary across different niches.
This information is also important for businesses looking to do a comparative study and determine which segment to target if they are deciding on their operational niche. Also, with this, they can assess their performance and set standards to get optimum results with their marketing efforts.

Online commerce conversion ratio by device
The conversion rate of an e-commerce website is widely distributed across different types of devices. A study by Kibo e-commerce Quarterly on quarterly e-commerce business data serves as a clear indication revealing the fact that bigger devices get you a higher rate of conversion compared to smaller gadgets and hand-held devices. The data captured for 2019-20 suggested the desktop conversion rate as 3.48% in Q3 2019 and 2.59% in Q3 2020, referring to the worldwide averages. However, this showed up as 3.56% to 3.41% for tablet PCs and 1.79 to 1.86% for mobile devices across the period.
Here in detail:


While the world is moving towards mobile devices, you might find it contradicting to see more conversions on bigger screens. But, as a matter of fact, users find it more convenient and safer to do their purchases on desktop screens. This is why the average order value for bigger screen utilities was registered 42% higher than mobile devices in Q3 2020.
Five key reasons stated by researchers about mobile devices being an unlikely choice for making purchases are security concerns, hard-to-see product details, difficult navigation, stiff multi-screen comparisons, and uneasy typing. All of these put together, make it tough for users to purchase through a mobile device.
Still, the other side of the fact remains, people are more active on smaller screens while browsing through details of products and doing research on what to buy. Possibly because they find it quite handy and quick to launch any screen on the move and start their search about just anytime anywhere on their handheld devices.
So, it’s time when you should opt for multi-screen usability options. Get your presence crafted on different display interfaces and device utilities. Get the user buying experience more personalized, easily navigable, and contextually intuitive, allowing your users to easily search and compare options to buy. Make the checkout process quick and smooth.
While you do this, leverage different devices at their maximum potential and combine that experience into one integrated offering, without missing the chance to convert.
Ecommerce Conversion Rates by Country
For many businesses that operate across countries, it gets important to know the conversion benchmarks that prevail in the geographical confines. As this is the only practical way to gauge performance and build and validate your plan around promotions when you are targeting different locations.
Getting the exact KPIs for different segments across different countries you need to know the level of consumer receptivity and tech-savviness of users from the target location. You can get a wholesome idea of it by knowing the overall average conversion rates and the way it looked over time and combining this data with consumer studies from different countries depicted for a certain time range.
Here is the table depicting how different countries show up in terms of conversion rate:

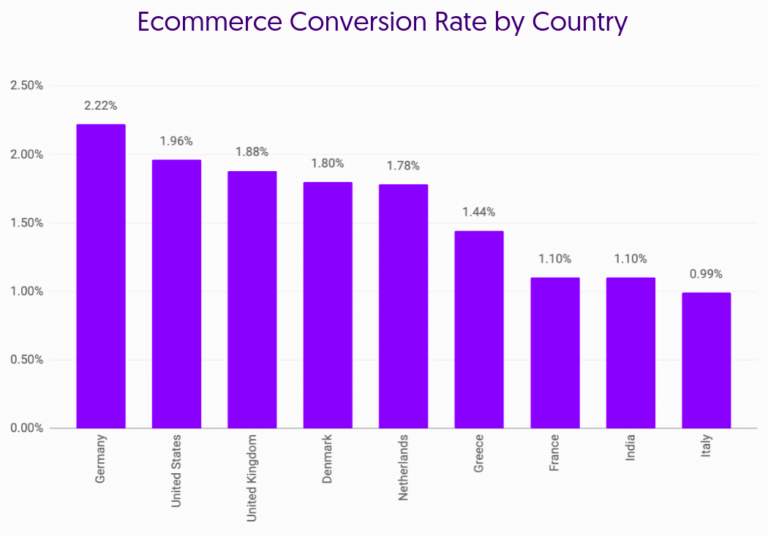
These stats get you the detail about the most prominent world economies. In this list, Germany stands on top of the conversion rate scale with a purchase-to-session ratio of 2.22%. This means if there are a total of 10,000 visits on all the e-commerce websites in Germany, then there will be about 222 purchases committed from those visiting sessions in total.
This number includes every type of traffic coming from different sources cumulatively for all the websites over a period recorded for a comparative study for different countries.
This is followed by the United States which shows a rate of 1.96% and the United Kingdom that stands at 1.88%. The lowest among the 9 countries is Italy that shows up a rate of 0.99%.
Google Ads Mobile Conversion Rate Across Industries
As per the 2020 studies for Google Ads across different industry segments, you can find that the average conversion rate in Google AdWords on mobile devices cumulatively for all industries is 4.1% on the search network and 0.6% on the display ads network.
As you can see in the graph, the highest performing industries here are Travel & Hospitality, Art & Entertainment, and Hair Salons for the search network. Again the highest converting segments for the display network are Hair Salons and Art & Entertainment.
Automotive and healthcare show up the least conversions in display ads and Internet & telecom has the least users converting into customers.
If you look into the overall data, you can easily spot that the conversion rate in the search network is higher for all the sectors compared to their display network counterparts.
These results can be used by you for start-up modeling to ascertain and validate your business plan. So, if you are into a trade that is present across different industries you can work on your campaign plans and set your ad spend targets and promotional budgets to get the maximum value out of it.
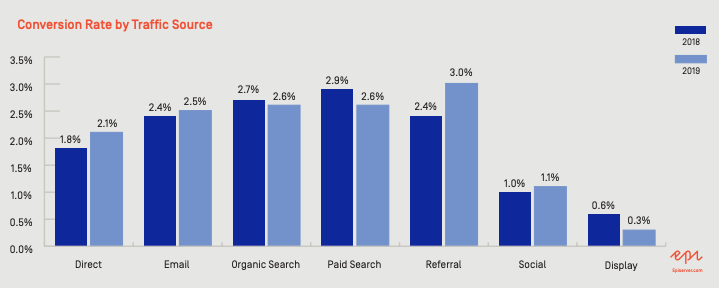
Conversion rate by Channel
There was broad data-intensive research conducted by Episerver for e-commerce retail in Q1 2020. It studied vast industry data spanning 1.3 Billion unique shopping sessions collected from 159 online stores. This revealed some interesting and useful patterns about the conversion funnels and user responses. It suggested that conversion rates are notably higher when consumers have high intent to commit a purchase. This is when they are making a search for products and categories.
The rates go significantly lower on social networks and reference sites that do not have users with a strong, immediate, or direct need to commit any purchase. Emails have also shown lesser responses and conversions owing to their less interactive bulk-behavior nature that mostly reaches random people targeting a pool of community databases.

Landing Page Conversion Rate Comparison
An Unbounce report on landing page lead generation conversion rate gets you a comparison of different industry verticals. This research was conducted for different businesses performing in different capacities across different locations. The campaigns were targeted towards different audience groups and user networks.

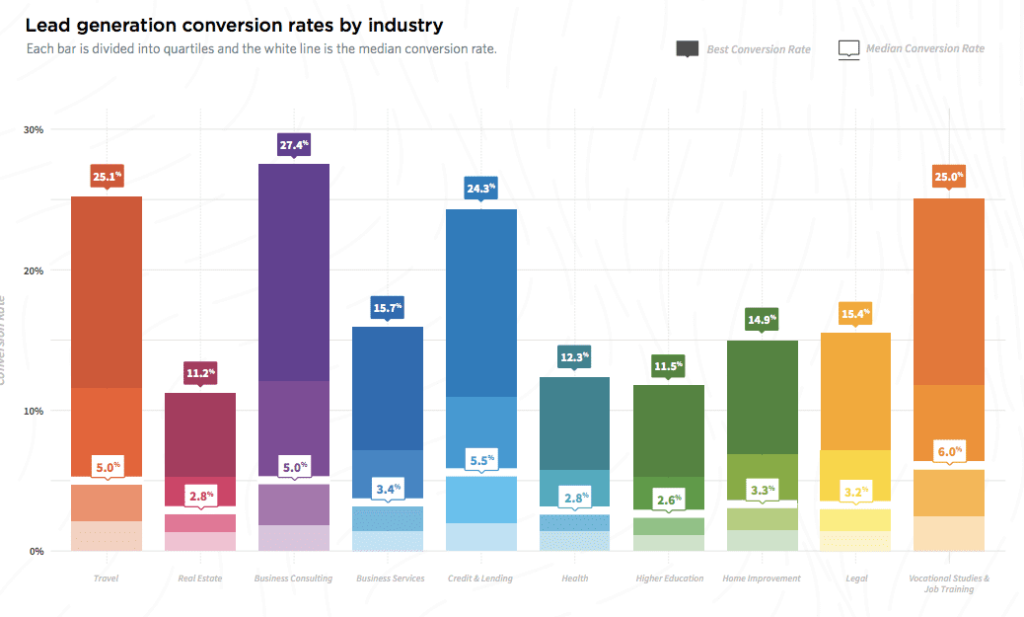
The graph above shows the vast variations between different industry verticals and functional sectors achieving different digital conversions. Here, you can see the highest converting landing pages come from the niche of business consulting, travel, and vocational studies & job training with a lead generation conversion rate of 27.4%, 25.1%, and 25% respectively.
Driving Optimum Results by Segmenting Conversion Rates
As you keep conversion rates defined by ascertainable values and discreetly compounded categories, you get the most likely results with your efforts. As per marketing experts, different conversion rates and order values when categorized to fit in different performance potential, engagement scope, and quality scores, greatly improves the autonomy and accuracy of performance.
This gets you to elevate and optimize the quality of conversions by putting together the users with similar behavior, tendencies, or chronological standings. This can be done by segregating the first-time, repeat, and loyal customers in different categories of conversion value evaluations.
Similarly, this can be done for channel conversions, where you can categorize organic searches, affiliate programs, social media, and display ads putting them into different conversion rate assessment categories. This can be done for search types that can have different criteria of searches put into different reaching-out techniques and factors like paid, organic, generic, and long-tail keywords.
Also, while you consider conversions and purchases based on different parameters, consider separating commodity products like backpacks, gadgets, and household utilities from high-value items or products with some artistic-appeal like designer perfumes, personalized resin sculpture, or special edition watches.
While considering these factors bring into account the different timings and occasions of promotions. Coremetrics data has shown that market demand and sales in holiday or festive seasons increase dramatically across industries.
Conclusion
These performance estimates are based on broad industry data from different categories comparing various conversion touchpoints. You can refer to it by looking at your industry background and compare your campaign outcomes to figure out where you stand in terms of getting your users converted into customers as per the benchmarks.
You can club other measurable factors together referring to different performance metrics and data insights on how conversions show up on different trends, conditions, and characteristical parameters across geographical, demographical, and behavioral factors.
So, if you are running an ad campaign for a luxury automobile segment landing page and your channel is display ads to be seen to a target audience that is mostly using mobile devices, you have to set your mean conversion score calculating the performance averages of all the factors combinedly.
This will get you the relative proportions of views and sessions against the actual conversion happening in the form of purchases, subscriptions, opt-ins, participations, or affiliations, as the case may be. This is going to get you the right standpoint to compare your metrics and get you to find optimum spots of conversion in your trait and situation of online commerce.
Get to know how you can work on increasing the reach and visibility of your e-commerce website and get help with e-commerce optimization from domain experts.